- Home
- Market Failure
- Socially Optimal Quantity

Socially Optimal Quantity Explained
The socially optimal quantity of production and consumption of a product becomes relevant whenever there are significant 'externalities' present in a market. In reality, virtually all markets have some external costs and/or benefits, and the case for corrective measures must be judged individually.
The problem is that, because buyers and sellers tend to act in order to maximize their own personal gains from trade, there is often insufficient regard for the impact of that trade on society as a whole. This has the implication that not all costs and benefits are being accounted for in that private trade between buyer and seller, and as a result there will be a sub-optimal quantity of production/consumption that occurs unless corrective action is taken.
On this page I will demonstrate this with the aid of graphs for illustrative purposes.
Readers are encouraged to see my main page about externalities if it is unclear why some products have associated costs and/or benefits over and above those resulting from free-market outcomes.
Here I will continue to use the example of vaccines as a product that comes with significant external benefits. For an example of negative externalities, I will use a chemicals factory that creates pollution as a by-product of its manufacturing process.
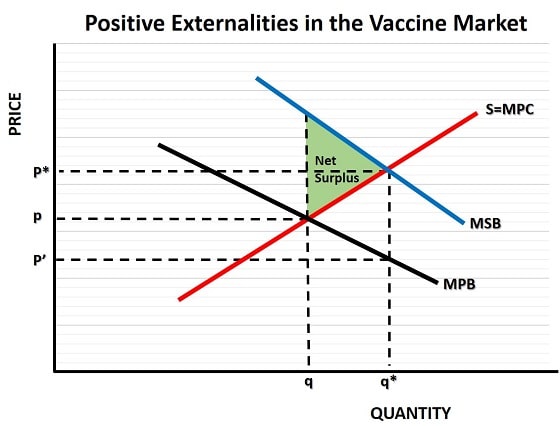
In the graph below I'm presenting the cost/benefit trade-off of a vaccination against a typical seasonal flu virus. The actual positioning of the cost and benefit curves will vary depending on the severity of the consequences of not getting a vaccine, and the fears over potential side-effects of that vaccine, and many other real-world factors.

In many situations it may be deemed necessary for vaccines to be provided free of charge to consumers, and many western healthcare systems do exactly that, but for many diseases/viruses the threats posed to society are not serious and free provision may lead to over consumption. That would not be a good example of a socially optimal quantity or price, so I'll continue with the assumption that, usually, a non-zero price is necessary.
In the graph, the red S=MPC curve is the standard upward sloping supply curve in a typical industry. MPC represents the marginal social cost of production, and we assume in this example that there are no additional external costs for society from producing vaccines, and thus all relevant costs are represented by the standard industry supply curve.
The MPB curve represents marginal private benefit. In most industries this would be equal to the standard demand curve for a product, but in an industry with positive externalities there are additional societal benefits of consumption over and above those gained by the individual consumer.
The MSB curve represents the full marginal social benefits of various output levels of vaccinations in our hypothetical vaccine market. To achieve a socially optimal quantity of output we need to increase production from q to q*, this will yield an extra net surplus to society equal to the green area illustrated in the graph.
Getting to this level of output, however, presents a problem.
Socially Optimal Price
To achieve the optimal quantity of output at q*, firms will need to be paid a price of p* for each vaccine, but that is much higher than consumers are prepared to pay. As the MPB (marginal private benefit) curve in the graph above illustrates, at this optimal output level consumers will only be willing to pay p'.
In order to solve this problem, the government can subsidize firms to increase production levels. The required amount of subsidy per vaccine is equal to p* - p' and that is the amount that government will pay if it seeks to achieve the socially optimal price for vaccine producers.
P* is the socially optimal price, but only part of that price (i.e. p') is paid by consumers, the rest is paid by the government as a 'Pigouvian subsidy'.
Socially Optimum Quantity Formula; where marginal social benefit equals cost
The formula used to calculate the socially optimum quantity of output in an industry is extremely simply and can be stated as occurring when:
MSB=MSC
In words this means that when the marginal social benefit of output is equal to the marginal social cost of output, then we will achieve the socially optimal quantity of output.
A key point to note here is that we are, as is often the case in economics, concerned with marginal concepts and not total costs or benefits. Intuitively this is simple to understand, because if we were setting output to a level where its total social cost is equal to its total social benefit, then the net benefit would be zero! Clearly we can do better than that.

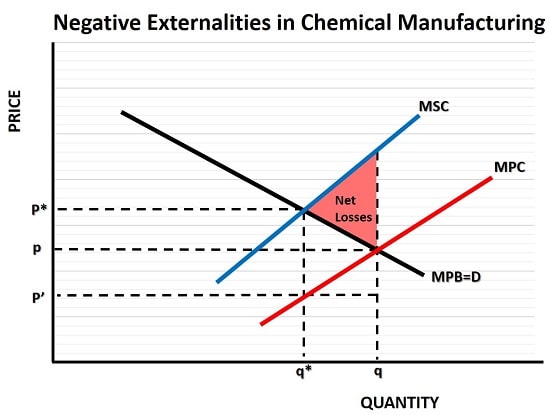
As an added example, consider the negative externalities that result from pollution entering the environment as a by-product of a chemical manufacturer's production process. If this external cost is ignored by society then the free-market will produce a quantity of chemical products of q at a price of p as illustrated in the graph above.
This level of production creates net costs to society as indicated by the red area in the graph, i.e. the area above the marginal private benefit curve and below the marginal social cost curve.
In order to correct this situation the government could impose a per-unit tax on production to reflect the true cost of production. The socially optimal price in this example is equal to p*, because at that price consumers will reduce their consumption to the socially optimal quantity of output at q*.
The free market will be happy to produce q* of output for a price of just p', so the per-unit tax needs to make up the difference between these two prices by equaling p* - p'. In so doing, the net losses illustrated by the red area in the graph can be avoided, because producers will not be able to make any profit from producing output beyond q*.
Criticisms for further study
Generally speaking the theory here is infallible, but in practice it is extremely difficult to apply it in the real world. As I alluded to at the top of the page, it is often impossible to know the exact positioning of the MSC and MSB curves, and without that knowledge it is impossible to optimally tax or subsidize production.
Even where reasonable approximations of these curves' positioning can be made at a point in time, it is highly likely that those positions will shift as circumstances change. Government policy-makers simply do not have the expertise to adapt policy in an optimal way in the vast majority of cases, and the costs of all the extra bureaucracy were it to attempt to do so would likely lead to serious loss of economic productivity.
If any proof of this were needed, consider the enormity of the disagreement that exists as to the costs of carbon emissions on climate change, or the dangers posed by Covid-19 and its vaccination options.
I will not get into the politics of either of these two examples, it is sufficient to point out that there is a great deal of disagreement present, which highlights the impossibility of prescribing a universally agreed corrective policy to reach the socially optimum quantity of vaccines or carbon emissions.
This is not to say that there are no circumstances in which reasonable judgments cannot be made, or that no corrective policies can ever be expected to yield better outcomes for society, but it does pay to err on the side of caution and approach each case with a first-do-no-harm mentality.
Related Pages: