- Home
- Production

The Production Possibilities Curve (Frontier) Explained
The Production Possibilities Curve, also commonly referred to as the Production Possibilities Frontier, gives us a simple model that can be used to illustrate some of the most fundamental concepts in microeconomics. It relates to the output decisions that firms make, and it is a good starting point from which to build out the 'Theory of the Firm'.
We always assume, in economics, that the key objective of any efficient firm is to maximize its profits. It is true that modern political pressures in the western world do encompass a broader role for corporate 'ESG' responsibilities in terms of social and environmental concerns, but it remains doubtful how sustainable that agenda will be in the long-run given that it necessarily comes with higher costs of production.
The costs of production are not some trivial matter that can be dismissed for some nobler objective, and any firm that allows its costs to significantly rise above that of its competitors will soon cease to exist.
This is because consumers will usually refuse to pay a higher price for goods and services regardless of corporate ESG targets, and the implication of this is that cost minimization remains a necessary objective of any firm that intends to remain competitive, and thereby earn sufficient profits for its shareholders. Most of those shareholders are regular people who are investing into their pension portfolios - they are not the 'greedy capitalists' that they are sometimes demonized to be).
In sum, if we recognize that as consumers we all want cheap prices, and that as workers we all want our pensions to fund our retirement dreams, we should also recognize that those things necessarily require firms to maximize their profits. It is the pursuit of profit that drives innovation and productivity, and as a society we really ought to respect it more...
The Production Possibilities Graph

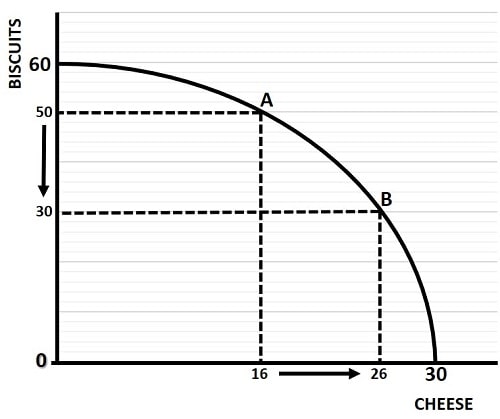
The graph above illustrates the concave production possibilities frontier that exists for output combinations of two goods i.e., biscuits and cheese in this example. The key to understanding this simple model is that it assumes a fixed amount of productive resources i.e., it relates to what can be produced in the short-run rather than what can be produced in the long-run where investment in new production facilities can be arranged.
With productive resources fixed, the maximum amount of biscuits that can be produced per time-period is 60 units, and for cheese it is 30 units. At these extreme points production is concentrated solely on one good meaning that there is zero production of the other.
Now, we can imagine that many of the resources used to produce biscuits are probably quite different to those used for producing cheese, and that they are therefore ill-suited to switching between production of the two goods. Some resources, e.g. cow milking machines, that are used for producing cheese will be completely useless for producing biscuits. The point here is that there are 'diminishing returns' to focusing more and more production on one good at the expense of the other, and this is why the production possibilities frontier is bowed outwards, or concave to the origin.
For example, imagine that production starts at point A with 50 units of biscuits and 16 units of cheese, and see what happens as we move to point B. In order to increase production of cheese by 10 units (from 16 units to 26), we must give up 20 units of biscuits (from 50 to 30). That's a two for one ratio, or in other words, at point A the 'opportunity cost' of producing ten extra units of cheese is 20 units of biscuits.
Now consider that ratio when we further push cheese production to its maximum rate of 30 units. To get the extra 4 units of cheese (from 26 to 30) we must give up all of the 30 units of biscuits. That's a 30:4 ratio, or 7.5 units of biscuits for each extra unit of cheese.
To be more precise, we would like to know at any given point on production possibilities frontier what the rate of transformation between the two goods is, and to see how that is calculated have a look at my article about the marginal rate of transformation.
Production Possibilities and Resources
A great deal of microeconomics is focused on the use of resources in the production of goods and services, with much work done to formulate output decisions into one equation or another. The two main types of resources are called capital (e.g., equipment and machinery) and labor (i.e., the workforce). These are not the only resources, but they are the two that are focused on when constructing mathematical equations to describe various types of 'production function'.
For a more detailed explanation of all the resource categorizations that economists use to describe how goods and services are created, my article about the four factors of production will be useful.
Production Possibilities Curve Expansion

As indicated earlier, any given production possibilities curve relates to a fixed amount of factors of production, implying that it relates to the short-run. In the long-run a firm and an entire economy can increase its productive capacity via investment that creates additional capital resources, or by research and development into more efficient production technologies.
Additionally. the workforce may expand (or contract), and workers can learn new skills that make them more productive. Over time entrepreneurs may spot new opportunities in the market that allow them to exploit a competitive advantage of some sort.
All of these long-run factors, and many more, will cause a shift in the production possibilities curve. Typically this shift will be an expansion as economic growth allows more goods and services to be produced as the level of technology improves. As growth continues, it may well lead to new cost saving opportunities to be realized in the form of economies of scale.
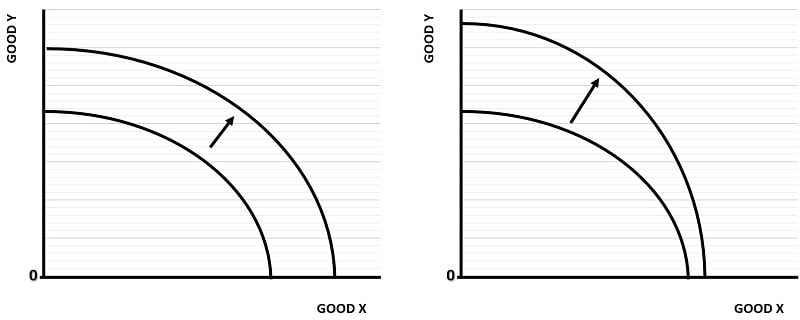
When an expansion of production possibilities does occur, it will allow more of all goods to be produced and the production possibilities curve will shift outwards as illustrated by the left-side of the diagram above. However, the left-side illustrates a uniform expansion such that the production of both good x and good y can be increased equally.
It is, of course, highly likely that an improvement to productive capacity will impact on the production of some goods more than others. In this case, the production possibilities curve will expand outwards in a skewed manner as illustrated by the right-side of the diagram above. In that example, an improvement in productive capacity increases production of good Y by to a larger extent than that of good X.
Related Pages: