- Home
- Aggregate Demand
- Marginal Propensity to Consume

What is Marginal Propensity to Consume? (Formula & Examples)
The Marginal Propensity to Consume is a fundamental concept in economics that measures the proportion of additional income that individuals choose to spend on goods and services rather than save. It represents the change in consumption that occurs when there is a change in income.
For example, if an individual receives an extra $100 and decides to spend $70 of it, the MPC would be 0.7. This concept provides insights into how changes in disposable income can drive short-term economic expansion or contraction around the long-term sustainable growth path, and it thereby helps policymakers to construct stabilization policies.
Factors influencing the Marginal Propensity to Consume (MPC) can vary from individual to individual and can be influenced by a range of economic and psychological factors depending on the unique individual circumstances that apply in any given situation. Some of the key factors include income level, wealth, interest rates, consumer confidence, societal pressures, and cultural norms.
Understanding all these factors is crucial for policymakers and businesses, as they can help predict consumer behavior patterns at the micro level. However, the MPC is more closely aligned with macroeconomic policy, and the consumption function in particular. This can come with some loss of precision, because the MPC tends to rely too heavily on changes in disposable income alone as a precursor to changes in consumption, and it tends to undervalue the other important components of consumer behavior.
Marginal Propensity to Consume Formula
In the simple aggregate expenditure model which uses the equation of a straight line to model consumption i.e., C = A + MPC (Y – T) the MPC is a constant. In this case we simply divide any change in consumption that follows a change in disposable income to arrive at an estimate of MPC.
In order to be able to work out how to calculate the marginal propensity to consume in more complicated equations, where consumption is not a constant, we can use calculus to arrive at the first derivative of that equation.
MPC = dC/dY
In words this simply means that the MPC at any given point is equal to the change in consumption divided by the change in disposable income at that point. This will vary depending on the level of disposable income, and the MPC will tend to be higher at lower income levels compared to higher income levels. This is explained below in the section about income inequality.
The MPC and
Appropriate Timeframe
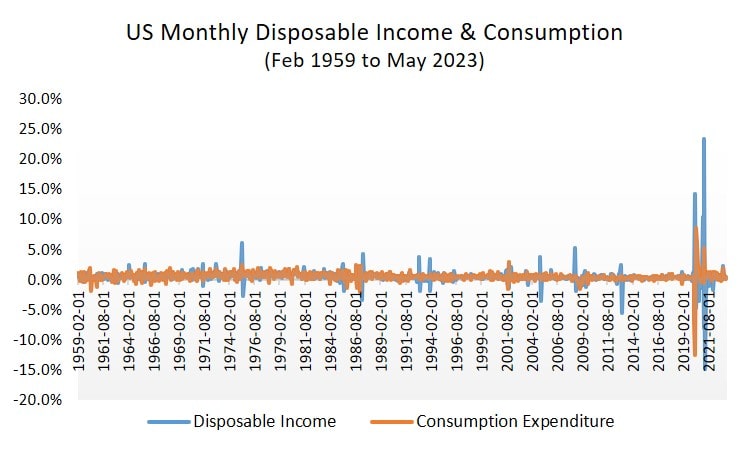
An important consideration when discussing the responsiveness of consumption to disposable income is that of timeframe. In the first marginal propensity to consume graph below, the timeframe considered is that of one month.
 Over periods of a month or so, consumption expenditure levels are only loosely related to levels of disposable income.
As can be seen, the blue troughs and peaks representing disposable income are considerably more extreme than the orange peaks and troughs which represent personal consumption expenditures.
The simple conclusion here is that while there is a correlation between income and consumption, it is quite loose when viewed from the short timeframe of a single month.
Another stand out observation relates to the recent period at the end of the graph. The huge swings in income and consumption at this time relate to the Covid-19 pandemic lockdown that led to a sharp contraction in consumer spending, and the huge stimulus packages that were sent out to support people's incomes.
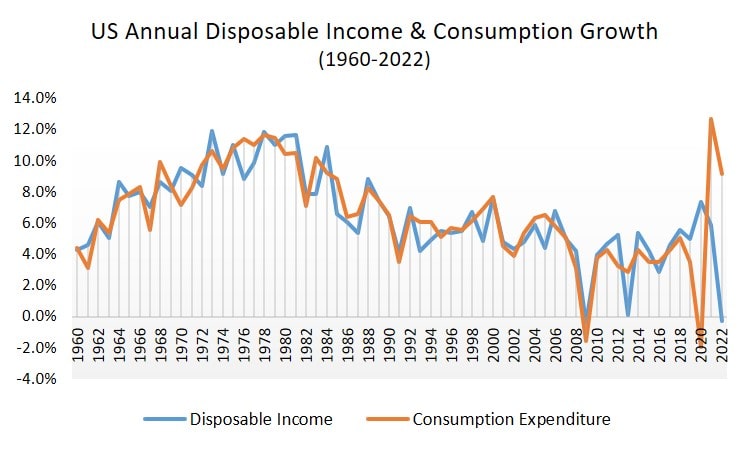
In the second graph below, the timeframe under inspection is one calendar year. As can be seen, income and consumption track one with another much more closely when measuring a whole year.
 Over an entire year, consumption expenditure levels move very closely with changes in disposable income levels.
The collapse in consumption during the lockdowns is more clearly illustrated, as is the explosion of consumption following the easing of lockdown restrictions.
There is one more important observation to be made, and that is that the MPC does not change noticeably as national income increases over the long-term. This is illustrated by the way that consumption grows just as fast as income over the entire period from 1960 to 2022.
The point is that while the marginal propensity to consume does tend to be lower for richer people than for poorer people, this trend operates within a given timeframe. It does not follow that as a country gets richer it will tend to save more of its income. If that were the case then the graph above would illustrate the blue income line as being somewhat higher than the orange consumption line on average.
Marginal Propensity to Consume Examples
Spending habits have a significant impact on the economy at both the individual and aggregate levels. At the individual level, consumer spending drives demand for goods and services, leading to increased production and job creation. For example, when consumers purchase new cars, it stimulates the automotive industry, creating employment opportunities for workers in manufacturing, sales, and services.
At the aggregate level, spending habits can influence short-term economic output levels and stability. During economic downturns, if consumers reduce their spending and increase their savings, it can exacerbate the contractionary effects of the downturn. This decrease in consumer spending can lead to reduced business revenues, layoffs, and a downward spiral in economic activity.
Conversely, during periods of economic expansion, increased consumer spending can fuel an unsustainable boom. During these times, spending on housing in particular tends to outpace the growth of supply, causing home prices to rise. This often spurs yet more demand for housing out of fear of missing out on the capital gains to be had from future house price increases. Ultimately reality will reassert itself and boom will turn to bust.
For these reasons, consumer spending is a key driver of the business cycle, and policymakers use the MPC in their calculations when constructing monetary and fiscal policy maneuvers.
The
multiplier effect and the MPC
The multiplier effect refers to the phenomenon where an initial change in spending or investment results in an even larger impact on the overall economy. The MPC plays a crucial role in quantifying the multiplier effect.
When individuals spend a portion of their additional income, it becomes income for someone else, who then spends a portion of that income, and so on. This chain reaction of spending leads to a multiplier effect that magnifies the initial impact on the economy. For more details on this, have a look at my article about the Keynesian Multiplier.
The MPC and
income inequality
The Marginal Propensity to Consume is usually higher for lower-income individuals, meaning that they are more likely to spend a larger proportion of their disposable income compared to higher-income individuals. In other words, people on lower incomes have less money remaining after purchasing essential items, and thus they save/invest a smaller proportion of little income that they do have.
Over time this means that people on lower incomes have much less ability to build wealth, and this means that they will have less money available for their retirement years.
The higher MPC of low-income groups explains part of the reason why stimulus packages during an economic downturn are targeted more at the poor. Not only are the poor more in need of help, their higher propensity to spend and financial assistance that they receive leads to a greater multiplier effect on the economy. This one reason why, for example, extra government spending on welfare checks during a downturn is preferred to tax cuts. Tax cuts would work, but to a lesser extent since higher income groups would benefit disproportionately.
Conclusion
The Marginal Propensity to Consume is a powerful concept that provides valuable insights into consumer behavior and its impact on the economy. Understanding the MPC, its magnitude and the relevant time-period to which it relates, helps economists make informed decisions and predictions about the economy.
Understanding the MPC helps policymakers to formulate appropriate stabilization packages in order to counteract the boom-bust business cycle.
Sources:
Related Pages: