- Home
- Unemployment
- Labor Force Participation Rate

Labor Force Participation Rate & Employment
The labor force participation rate measures of the proportion of working-age people in an economy who are either in working or actively seeking work. Sometimes this rate is expressed in terms of the civilian population, but the purpose is the same i.e. to record how engaged the workforce is.
The participation rate is an important addition to other measures of labor force engagement such as the unemployment rate, because it adds extra depth that the other measures can sometimes obscure. For example, we may hear from our political masters that unemployment is low, but that is of little comfort if it is only low because people have given up looking for work and thereby fallen of the official statistics.
The labor force participation rate would capture a more meaningful picture of the relative health and vibrancy of the labor market in these circumstances, and it should be less open to manipulation.
The way in which the official unemployment statistics have been compiled in recent decades has been changed multiple times and, just as with official inflation figures, the amended figures always seem to cast a more favorable light on the government of the day. For that reason alone we should be skeptical of such obvious political maneuvering, and look for more reliable data sources.
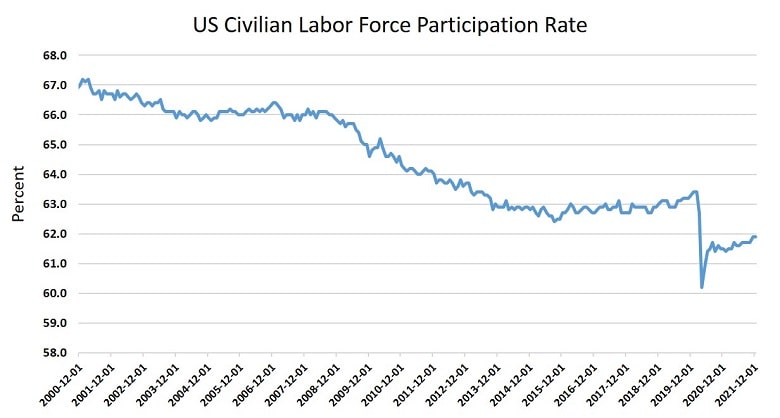
US Labor Force Participation Rate - FRED Graph
 Data Source: Federal Reserve Economic Data
The graph above illustrates the overall civilian labor force participation rate in the United States since the year 2000. I should point out here that the rate was at a historical high point at around the year 2000, and that the subsequent lower rates since then are not quite as dramatic as might at first appear. Nevertheless, there are growing concerns over the declining rate, and I have discussed this in my article:
Most notably at the current time, there is clear evidence that the participation rate has failed to fully recover in the aftermath of the Covid-19 lockdowns, despite recent announcements about the strength of the economy and the labor market. This is yet another example of creative accounting by public sector economists, but click the link above for more details.
Who is included in the labor force?
In the US the labor force is defined by the Bureau of Labor Statistics as including all civilians aged 16 and above who are either employed or unemployed. There are two potential causes of confusion here:
- Including everyone over age 16 is not always the preferred method in other countries. It's quite normal in other countries to specify that only 'working-age' people should be counted, and that anyone over retirement age should be discounted. Typically the age range 16 to 64 is used here. However, on the flip side, the retirement age itself may be different for different countries.
- The inclusion of the unemployed causes a lot of confusion since there is no universally agreed measure of unemployment. Most definitions stress that a person must be actively seeking work to be included in the unemployment calculation, but that leaves a large component of people who do not have a job, but who would like to get one.
For details about people who are typically excluded from the labor force statistics, see my article about:
- Who is not included in the labor force
Labor Force Participation Rate Formula
The formula for calculating the labor force participation is simple:
Labor force ÷ Civilian Population
As explained above, any confusion that arises with this formula are likely to stem from misunderstandings about who is included in the definition of the labor force, so be sure to clarify that if you need to be precise.
Labor Force Participation Vs. Employment
By now you will have realized that the labor force participation rate is a metric that tells us a lot more about the health of the labor market than merely focusing on the official unemployment rate statistics. However, rather than comparing it to unemployment, there is the question of how it compares to the employment rate as an indicator.
I think that the key difference relates to the business cycle and cyclical unemployment. If a researcher is interested in looking into the business cycle then the employment rate will give a better metric because it varies more depending on whether or not the economy is in a boom phase or a recession phase. The labor force participation rate on the other hand, since it includes official unemployment, will vary relatively less over any given cycle.
If a researcher is more concerned with long-term structural influences on the labor market then the preferred metric to look at will be the labor force participation rate. The key trends here are less reflective of short-term cyclical patterns, although extreme circumstances such as the Covid-19 lockdowns will still be seen.
The long-run trends illustrated in the graph above cannot be completely explained by cyclical factors, and so the labor force participation rate lends itself more to long-term studies of the economy.
Sources:
- FRED - Civilian Labor Force Participation Rate Graph
- Bureau of Labor Statistics - Labor Force Participation since the peak
- R. Duval Et al. - Labour Force Participation Hysteresis
Related Pages: