- Home
- Aggregate Demand
- Investment Spending

Investment Spending Examples & Meaning
The level of investment spending in an economy is held to be a key determinant of macroeconomic stability simply because it is the most volatile component of aggregate demand. Moreover, it is the key component that is most responsive to movements in the interest rate, and therefore monetary policy, meaning that it plays a crucial role in macroeconomic stability.
Much of Keynesian demand management is built around the volatility of investment spending in the economy, and on this page I will delve a little deeper into what it is, where it comes from, and how it fluctuates. I'll start with an analysis of its volatility.
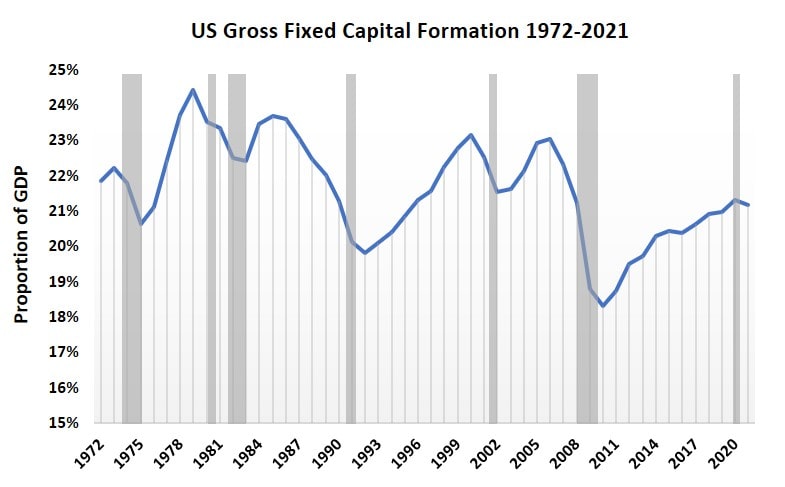
In the graph below I've plotted the level of Gross Fixed Capital Formation (the standard measure of investment spending) as a proportion of national income (GDP). The vertical grey bars represent periods of recession in the US since 1972 (the earliest date available).
Investment Spending Examples of Volatility
Clearly, since a recession technically means a period of a least 2 quarters of falling GDP, if spending on investment is falling as a proportion of GDP during those periods then we can conclude that it is more volatile than the other components of GDP.

This is confirmed by the diagram above. There have been a total of seven technical recessions in the US from 1972 to 2021, and on each occasion investment spending has been falling faster than overall GDP. Furthermore, on no occasion when investment fell significantly as a proportion of GDP did the US escape going into a recession.
So far everything is just as mainstream economics would have predicted, but we need to look further, because investment spending is not one unified whole that reacts uniformly.
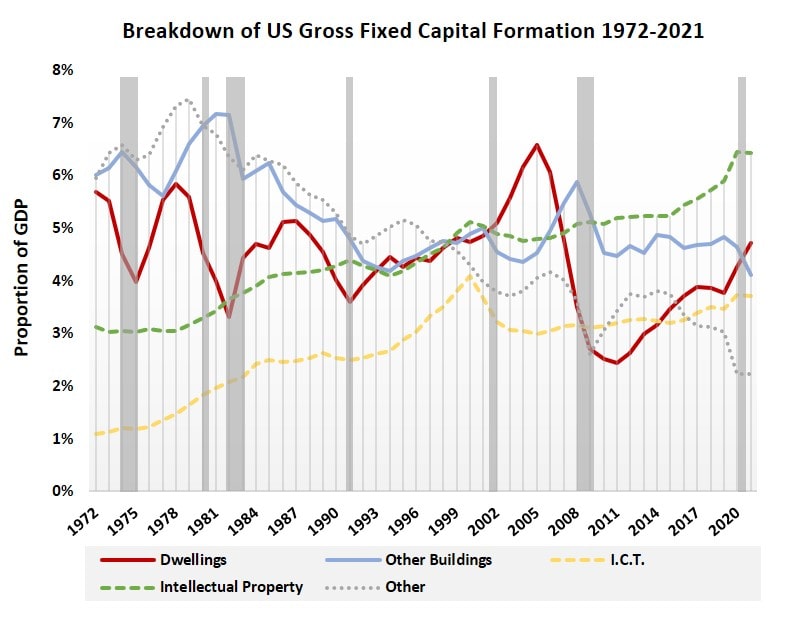
In the graph below I have again presented total gross fixed capital formation (GFCF) since 1972. but this time I have split it up to illustrate the most important types of investment spending by asset type. All of the figures for the graphs on this page have come from the OECD, see the link at the bottom of the page.
Gross Fixed Capital Formation & GDP
This is where the data starts to get interesting. Keynesian economics argues that it is business investment that is most volatile and also most responsive to interest rate changes. This is because, as the theory goes, a higher interest rate will make some investment projects less economically viable and thereby reduce spending, whereas lower interest rates make those projects profitable, and therefore should increase spending.

If this theory is correct then it is a little strange that there are marked differences across asset class, because all of these assets will be more or less profitable depending on the cost of capital i.e. the interest rate charged on borrowing for investment. Admittedly there are many other drivers of projected profits, but lets look again at the data.
The two dashed lines are relatively stable and increasing over the entire period. There was a peak around the year 2000 for investment spending in the Information & Computer Technology asset class (as a proportion of GDP) and that coincides with the Dot-Com bubble, but other than that there is relative stability. Intellectual Property investment has been very stable, growing consistently regardless of recessions over the period.
The dotted grey line is a catch all for every other type of GFCF, and it started the period as the highest component of investment spending. However, since the late 1970s it has been declining. I suspect that this is mainly composed of investment in manufacturing and traditional heavy industries, because these have been largely relocated to the developing world.
That leaves us with dwellings and other buildings.
Whilst investment spending on both dwellings and other buildings has been quite volatile over the whole period, it is particularly volatile for dwellings. Furthermore, if you compare the level of spending on these two related assets with the periods of recession as shown, you'll notice that it is spending levels on dwellings that are most closely correlated with the business cycle.
This is quite surprising, and not consistent with the Keynesian macroeconomic model of short-term demand management. Why is that? Because in periods of strong house price increases, demand is quite resistant to interest rate rises because any extra cost of mortgages is usually far exceeded by potential losses from missing out on potential property price increases in the next period.
The volatility of investment in dwellings is most clearly evident in the run up to the 2007-08 financial crisis, and its aftermath in the following years. Intuitively this makes perfect sense, because it was a housing boom with excessive bank lending for mortgages that led to the crisis. I will further investigate this in the next diagram.
Government, Consumer, and Business Investment
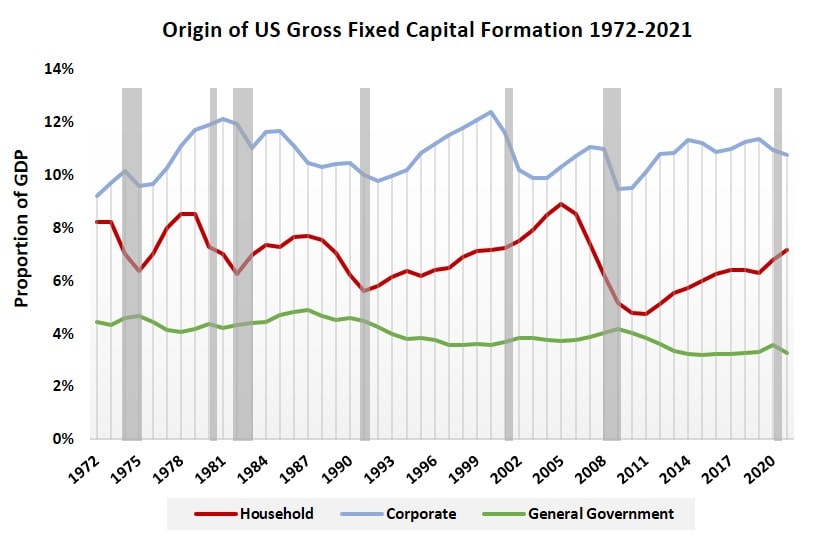
In the graph below I've illustrated the breakdown of investment expenditures by sector from which it originates i.e., household, corporate or the government.
As can be seen by the red line in the graph above, it is household investment that most closely aligns with spending on dwellings, which confirms the earlier intuition that it is the spending of regular people rather than businesses that led to the house price boom and resulting collapse in 2007-08.

This is not to put the blame on people, a competent economic reaction to the booming house price market would have delivered significantly higher interest rates before the boom even got going, but as I've explained on my page about inflation, the government does not even include housing and real estate in its estimates of inflation - much less the central bank's monetary policy.
This is one of the most inexcusable in failures of western governments, and as I've further evidenced in my article about fractional reserve banking, the housing market really has been at the heart of the economic business cycle in recent decades. Its treatment by policy-makers is akin to the treatment of Cassandra in Greek mythology i.e. always right, and always ignored.
Tobin's Q Theory of Investment
The Q Theory of Investment relates the stock market valuation of a firm to the amount of investment that the firm will engage in. Intuitively we can imagine that since a firm's stock market valuation can be higher or lower than the actual accounting value of its physical assets, the difference should matter in some way.
For example, if the stock market valuation is higher, then the firm could simply invest more in order to expand its physical size, and then sell more shares on the stock market to cover the cost of that investment. If the high stock market valuation holds then the firm should be able to raise more money from the share sale than the cost of the new investment.
The Tobin Q Ratio gives a simple estimate of the relationship between stock valuation and accounting valuation, and anytime that this ratio is above 1 should imply more investment spending.
Of course, the real world is much more complicated, and the studies that have been conducted on the Q theory of investment have not been overwhelmingly conclusive regarding its efficacy.
Other Types of Investment
The main type of investment that is not captured at all by the official figures shown here is that of human capital i.e. investment in education and skills. Some estimates regard this type of investment as being equally important to economic output, and in an increasingly complex job market it would seem likely that its importance will continue to grow in future years. For more information on this, see my article:
Whilst the main thrust of my argument on this page is that it is household investment spending in the housing market that has been the most influential driver of the business cycle in recent decades, business investment is still important, and for more information on that, have a read of my article:
Finally, the remaining type of investment that I have not discussed here is inventory investment, i.e. stocks and unsold output held by businesses, and for my thoughts on the economic impact that this sort of investment has on the business cycle, see:
Sources:
Related Pages: