- Home
- Economies of Scale
- Increasing Cost Industry

Increasing Cost Industry Types
An increasing cost industry structure occurs when any long term increase in output can only occur with extra costs that will drive up prices, all other things being equal. This condition holds productivity factors constant, so that the effects of improved technology do not confound the analysis.
That does not mean that improved technology is impossible, merely that it is held constant in order to highlight the existing set of circumstances that characterize the industry under inspection.
We also need to keep in mind here that we are talking about the long run industry characteristics, meaning that costs of production will be increasing even as short run supply curves shift to a new equilibrium, i.e. we are not just looking at the cost increases resulting from a movement along an existing short run supply curve.
Examples of this sort of industry are somewhat limited due to the presence of economies of scale in most industries, that allow costs to fall as output increases, or at least to hold constant. However, many of the 'primary sector' industries do exhibit increasing cost industry structures.
Increasing Cost Industry Graph
By 'primary industries' I'm referring to those firms that produce raw materials like coal, oil & gas, timber, precious metals, and most other commodities. Basic food products like grains, fruits, and vegetables can also experience increasing costs of production, but not always.
Where they do exist it is usually in less developed countries where levels of mechanization are sub-optimal given the existing technology available, and where farms tend to be much smaller than their more efficient counterparts in the developed world.

The best examples of increasing cost industry types are the mining industries, because it is often increasingly difficult and expensive to increase production here due to the product being increasingly harder to reach and extract.
Not only do existing mines have higher costs associated with increased production, the whole industry usually requires a great deal of time and expense in order to explore and identify potential new mines. Even when discovered, the planning horizon can run into decades before a new mining operation is approved, and even then there are significant risks of failure involved.
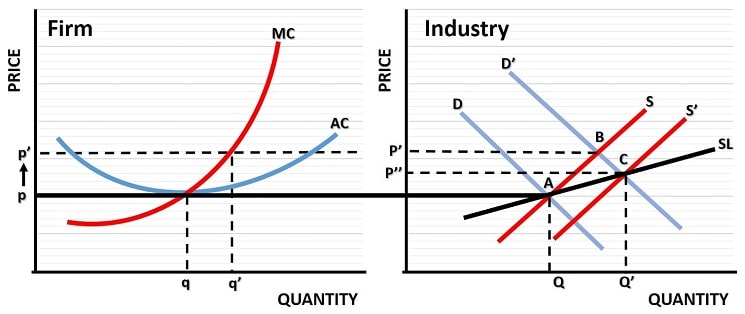
In the increasing cost industry graph above, we start on the left side of the graph with a typical mining firm that has existing facilities producing an equilibrium quantity (q) of ore at a price of p as illustrated. Now, for some reason, the demand for more production increases at the level of the entire industry, and market demand shifts from D to D' as illustrated on the right side of the graph.
As an example of what might cause this sort of shift, consider a world where the global monetary authorities had expanded their fiat currencies to such an extent that global investors become so wary of the potential debasement of those currencies that they wish to hold securities which can protect them from the ravages of inflation.
In this situation the market demand for gold might increase significantly, thereby causing gold mining companies to increase production from their existing mining facilities. Increasing investment levels into new gold mining operations for extra long term production would also be incentivized.
Given the existing short run industry supply curve illustrated on the right side of the graph, the increased demand shifts the market equilibrium from point A to point B. This in turn increases the industry price level from p to p'.
Back to the left side of the increasing cost industry graph, we see that with a price of p' the typical firm will be able to increase its output level from q to q'. Output expands for each firm until the last unit of output produced matches the price that can be charged for it. This occurs where the marginal cost curve (MC) is equal to the new price p'. When all existing firms have similarly increased their output levels, we will have reached point B on the right side of the graph.
Point B simply represents the short run reaction of the increasing cost industry to its new higher market demand curve. In the long run the higher price in this industry will entice existing firms to invest in new mining operations as well as entirely new entrants to come into the industry.
Therefore, in the long run, we will see some expansion of market supply such that the industry supply curve will shift from S to S'. This in turn will allow prices to fall somewhat as a new market equilibrium price and output level is discovered. Ultimately the industry price and output levels will settle at point C as illustrated.
The key point is that, at this final equilibrium point, the long run price of p'' is permanently higher than the initial price of p. This is what distinguishes an increasing cost industry.
Whilst not illustrated in the graph, the typical firm in this industry will now have a new average cost curve that is minimized at a price of p''. This does not mean that each and every firm will have that same average cost curve, only that the typical firm will have it.
Related Pages: