- Home
- Market Failure
- Allocative Efficiency

Allocative Efficiency Explained (with graphs)
Allocative efficiency is a core concept in microeconomics, referring to a state of resource allocation where the distribution of goods and services aligns with consumer preferences. In efficient economic systems, resource allocation is managed in a way that maximizes total consumer and producer satisfaction, meaning no additional gains can be achieved for one person without making someone else worse off.
This concept is particularly important because it ensures that resources are not wasted and that consumers are obtaining the most satisfaction possible from what is available.
Unlike productive efficiency (or technical efficiency) which focuses on the production of goods at the lowest possible cost, allocative efficiency is concerned with ensuring that the mix of goods produced matches societal demand as closely as possible. Achieving allocative efficiency is often considered an ideal goal in competitive markets, as it represents a balance where supply and demand meet naturally.
However, it can also serve as a benchmark to identify inefficiencies and market distortions that are dominated by monopolies, face market failures, or involve externalities.
Allocative Efficiency and Trade
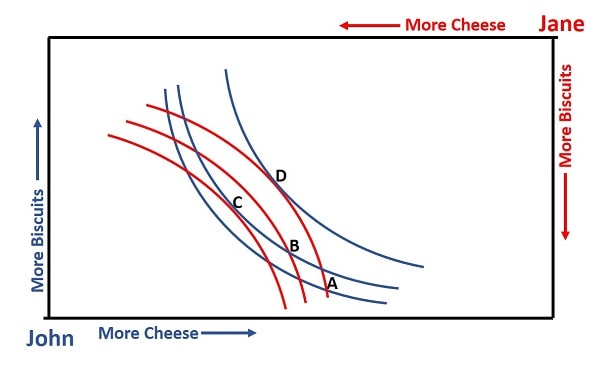
In the graph below I present a simple Edgeworth Box Diagram that illustrates indifference curves for John (bottom left corner) and Jane (top right corner). If you are unfamiliar with these concepts then have a look at my dedicated articles at:
 Achieving Allocative Efficiency via Trade.
Starting at point A in the graph, both John and Jane consume quantities of cheese and biscuits, but both are consuming on the lowest indifference curves illustrated. Clearly, if John and Jane were to trade then one or both parties can improve their circumstances by gaining a more desired combination of cheese and biscuits.
At point B, where John has given up some cheese and gained some extra biscuits, he has moved to a higher blue indifference curve. Jane has similarly moved to a higher red indifference curve by accepting the cheese that John gave up, and trading him the biscuits in their place.
Both parties have attained greater marginal utility (satisfaction) since both have given up some of the good that they had a relative abundance of in order to obtain more of the good for which they had a relative scarcity. The level of allocative efficiency has therefore improved, but it is still not optimized since both John and Jane can make further marginal utility gains via yet more trade.
Optimal allocative efficiency is achieved where John's indifference curve is tangential to Jane's indifference curve, meaning that their Marginal Rate of Substitution is equalized i.e., where neither party has a relative abundance or scarcity of either good. In the graph, I have illustrated two points where these conditions are satisfied - points C and D.
At point C, Jane has managed to increase her utility by moving to her highest indifference curve in the graph, while John has simply moved along the same curve that he was on at point B (indicating that he is indifferent between the combination at point B or C).
Conversely at point D, John has moved to his highest level of utility illustrated, but at this point Jane's utility is lower than at point B, and is back down to point A.
Either of points C and D represent full allocative efficiency, i.e. Pareto Efficiency, because neither John nor Jane can make further increases in their utility without causing the other party to lose out. Which of these two points will win out will come down to which of the two parties has better negotiating power, but it is clear that John cannot achieve point D from a starting point of point B, because Jane would have to accept reduced utility. His only hope is to try and persuade Jane to move to point D from a starting position at point A.
Jane has a clear advantage in achieving her most desired outcome at point C, because this point can be reached from point B with no loss of utility to John, or from point A where John will achieve a small utility boost.
Note that Pareto efficiency requires that no one can be made better off with someone else being made worse off. This is important because, from a starting position at point A, point D is Pareto efficient because John is much better off and Jane is no worse off. However, from a starting position of point B, point D is not Pareto efficient because moving to point D from point B makes Jane worse off.
Allocative Efficiency and the Contract Curve
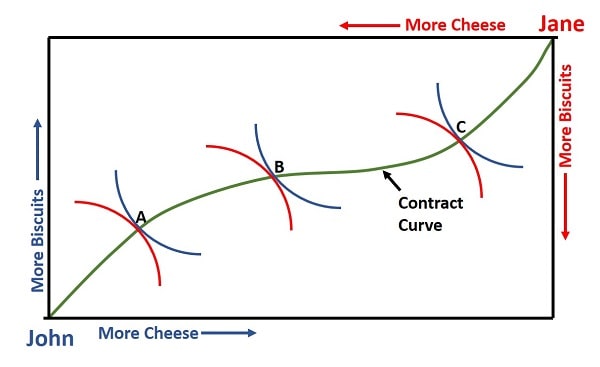
Allocative efficiency occurs at all points where John and Jane have tangential indifference curves, where their Marginal Rate of Substitution is equal. However, which two sets of indifference curves are settled upon is not explained, and comes down to negotiating power between the two parties.
 Allocative Efficiency and the Contract Curve.
What we can say is that, for given alternative indifference curves for one party, full allocative efficiency (Pareto efficiency) is achieved where the other party's indifference curve is tangential to those given curves.
When we connect up all of these potential tangential points, we have derived the Contract Curve. The Contract Curve shows all points at which Pareto efficiency is achieved.
In the Edgeworth Box diagram above, points A, B and C are all Pareto efficient points. Note, however, that whichever point prevails it is not possible to move along the Contract Curve to another point, because this would entail one party being made worse off. The points simply reflect all points of Pareto optimality, which point prevails depends on the negotiating power of the parties involved.
The Price Line and Competitive Markets
So far I have not discussed the prices for which biscuits and cheese are exchanged at, but I will include this consideration now.
In any competitive market where there are lots of buyers and sellers, neither John nor Jane is likely to be able to influence the price at which these goods are traded. That being the case, we need to consider the budgets that consumers have with regard to their utility maximizing consumption bundles. I have done this already in my article about:
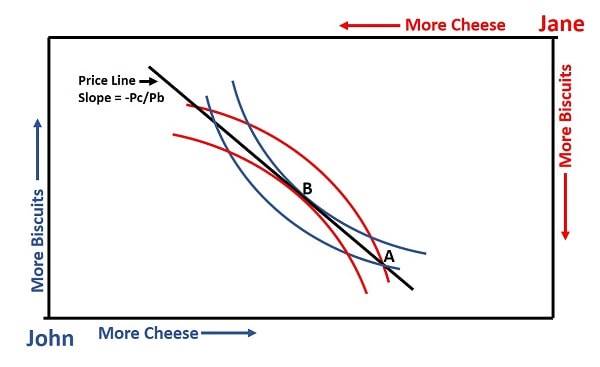
In that article I showed that utility is maximized where the highest indifference curve possible is one that just touches (is tangential to) the budget line. The slope of a budget line is equal to -Pc/Pb (where Pc is the price of cheese and Pb is the price of biscuits).
In equilibrium, this slope will also be equal to John and Jane's Marginal Rate of Substitution.
When the price line (or budget line) is added to the Edgeworth Box diagram, an efficient outcome is more readily agreed upon due to prices already being known.
 Allocative Efficiency in Competitive Markets.
In the graph above, starting at point A, both John and Jane will immediately adjust their starting bundle of biscuits and cheese to their preferred bundle at point B. Both parties know the prices of these products and how they wish to allocate their spending, so this happens automatically and the market clears itself without any need for negotiation between the parties.
Of course, if there is disequilibrium in the market, with an excess supply or demand for either cheese or biscuits, then the relative prices of these products will change and a new price line will emerge. John and Jane will then react to that by selecting their new utility maximizing indifference curves and equilibrium will again be restored.
Market Structure: Competitive Markets vs Non-Competitive Markets
Allocative efficiency is most readily achieved in a market structure of perfect competition, where prices act as signals that naturally balance supply and demand. In such markets, a large number of buyers and sellers ensures that no single entity can influence prices, leading to a state of equilibrium where consumers can access goods at prices reflective of their true market value.
In contrast, non-competitive markets can impede allocative efficiency by distorting prices or restricting the quantity of goods available due to their market power.
- A firm in monopolistic competition, for example, may restrict supply to keep prices higher, meaning that potential consumer surplus and producer surplus is lost due to the inefficiency of high prices and reduced output.
- Oligopolistic markets, with only a few large firms, might lead to collusion, where firms agree on pricing that can also prevent the market from reaching allocative efficiency.
In non-competitive markets, achieving allocative efficiency might require external interventions, like antitrust laws, price caps, or subsidies, to correct these distortions and bring the market closer to a state where resource allocation happens according to consumer preferences.
Conclusion
Allocative efficiency represents an ideal state in economics, where resources are allocated in a way that perfectly matches consumer preferences, maximizing both consumer and producer satisfaction. Reaching this state is particularly feasible in competitive markets where prices and supply can adjust freely to meet demand.
However, achieving allocative efficiency in markets with distortions, such as monopolies or externalities, often requires thoughtful intervention to correct imbalances and improve welfare outcomes.
What is allocative efficiency?
What is allocative efficiency?
Allocative efficiency is a state of efficient resource allocation in which goods and services are distributed according to consumer preferences. In this state, total consumer and producer satisfaction is maximized, meaning that no additional gains can be made for one person without making another person worse off.
Why is allocative efficiency important?
Why is allocative efficiency important?
Allocative efficiency is essential because it prevents waste and ensures that consumers obtain the highest possible satisfaction from available resources. It optimizes production possibilities where supply and demand meet naturally.
How does allocative efficiency differ from productive efficiency?
How does allocative efficiency differ from productive efficiency?
Allocative efficiency achieves production of the correct mix of goods to meet societal demand, while productive efficiency is about the production of goods at the lowest possible cost. Allocative efficiency ensures goods are distributed according to consumer preferences, not just cost minimization.
How does allocative efficiency serve as a benchmark in economics?
How does allocative efficiency serve as a benchmark in economics?
Allocative efficiency can highlight inefficiencies in markets, such as monopolies or market failures. By comparing actual market outcomes to an allocatively efficient benchmark, economists can identify areas where resources may be misallocated or where interventions may be needed.
What is the Contract Curve in the context of allocative efficiency?
What is the Contract Curve in the context of allocative efficiency?
The Contract Curve is the set of points in the Edgeworth Box where all allocations are Pareto efficient. It represents the set of points where both parties’ indifference curves are tangential, meaning their MRS is equal.
Why can’t one party move along the Contract Curve without making the other party worse off?
Why can’t one party move along the Contract Curve without making the other party worse off?
Since all points on the Contract Curve are Pareto efficient, moving along the curve would reduce one party’s utility, violating the condition that no one can be made better off without making someone else worse off.
Related Pages:
- Excess Supply
- Excess Demand
- Dynamic Efficiency
- Productive Efficiency
- Economic Efficiency
- Externalities
- Market Failure
About the Author
Steve Bain is an economics writer and analyst with a BSc in Economics and experience in regional economic development for UK local government agencies. He explains economic theory and policy through clear, accessible writing informed by both academic training and real-world work.
Read Steve’s full bio
Recent Articles
-
Bank Reserves, Asset Inflation, and the Risk of Future Price Inflation
Dec 19, 25 04:16 AM
Learn what bank reserves are, how they affect asset prices, and why future reserve creation could lead to inflation through commodities and currencies. -
Credit Creation Theory; How Money Is Actually Created
Dec 16, 25 03:07 PM
Explore how modern banks create money through credit creation, why the money multiplier fails, and the role of central banks and reserves. -
U.S. Industrial Policy & The Unfortunate Sacrifice that Must be Made
Dec 12, 25 03:03 AM
U.S. Industrial Policy now demands a costly tradeoff, forcing America to rebuild its industry while sacrificing bond values, pensions, and the cost of living. -
The Global Currency Reset and the End of Monetary Illusion
Dec 07, 25 03:48 AM
The global currency reset is coming. Learn why debt, inflation, and history’s warnings point to a looming transformation of the world’s financial system. -
Energy Economics and the Slow Unraveling of the Modern West
Dec 06, 25 05:18 AM
Energy economics is reshaping global power as the West faces decline. Explore how energy, geopolitics, and resource realities drive the unfolding crisis.