- Home
- Market Failure
- Marginal External Benefit

Marginal External Benefit Explained (with a graph)
A marginal external benefit, also known as a positive externality, occurs whenever the consumption or production of a good/service leads to benefits that are captured by the wider population i.e. external to the buyer's or the seller's gains from a trade.
In practice, we are only concerned with those situations in which the marginal external benefit is large enough to matter. There are almost certainly some positive externalities associated with almost all products, but they are usually too minor to make a significant impact on market outcomes.
There are other cases where there is a significant external benefit associated with a product, but there is still insufficient cause for any corrective action because the costs of such action is prohibitive. No market is perfect, but that in itself is not a justification for intervention, and we always need to take account of the costs of any intervention.
This is one of our greatest mistakes in economics, because the urge to take action wherever an inefficiency presents itself is great, and the law of unintended consequences is easy to dismiss.
Marginal External Benefit & Marginal Social Benefit
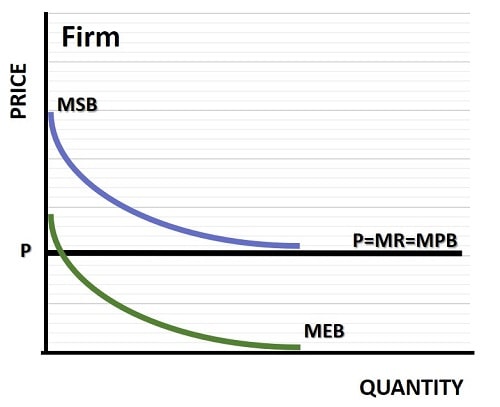
The marginal external benefit curve (MEB) is directly linked to the marginal social benefit curve (MSB). In the graph below this is clearly illustrated, and the difference between the two is equal to the marginal private benefit curve (MPB).

For a firm in a competitive market, P=MR=MPB=Demand.
This is simply the price line, because the marginal revenue curve for a competitive firm is equal to the market price, which in turn is equal to MPB and the demand curve. This is because competitive firms have no market power to influence prices, and simply accept the going rate.
In the graph the going rate is P, and it is horizontal indicating that no matter what level of production the competitive firm chooses to supply, it will not be a large enough proportion of the total industry supply for the firm to be able to affect the price.
Marginal External Benefit Formula
Since MSB is, by definition, equal to MPB + MEC, we can do a very simple rearrangement of this equation to derive the marginal external benefit formula:
MEB = MSB - MPB
(Remembering that MPB is equal to MR, price, and demand in a competitve industry.)
Mastering the equations above is not essential for your understanding of the concept involved here, and even when mastered they are quickly forgotten. For this reason I prefer to use graphs to illustrate these relationships since the visual aspect is immediately apparent and more memorable.
The same sort of analysis applies for non-competitive markets, but in that case the demand curve will not be a horizontal price line and MR will differ from price. However, in all cases (competitive or not) the MPB curve is equal to the demand curve and price, so MEB will always be equal to MSB minus MPB.
Slope of the Marginal External Benefit Curve
The MEB curve slopes downward as illustrated in the graph, and the reason for this is that it is usually the case that, beyond some level of output, further benefits to third party citizens cease. For example, if 20% of the houses in a neighborhood decide to renovate their houses, then there will be overall gains for that neighborhood.
All property prices may rise as the area becomes more appealing, even for houses that have not been renovated.
If a further 30% of the houses are also renovated then there will be additional property price gains for all the other houses as the area becomes even more desirable. Eventually, however, a point will be reached where the desirability of the neighborhood is more or less optimized, and no further marginal external benefit will be gained for those houses that are not renovated.
At this point the slope of the MSB curve in the graph above would be zero, i.e. the curve would be horizontal indicating that no further external benefits are possible from further renovations.
Cost Considerations
Analysis of benefits alone is not sufficient to fully understand the workings of the market, and I would advise the reader to complement the material on this page with the material on my page about Marginal External Cost.
Related Pages:
- Marginal Social Benefit
- Socially Optimal Quantity of Output
- Pigouvian Subsidy
- Externalities in Economics
- Types of Market Failure
About the Author
Steve Bain is an economics writer and analyst with a BSc in Economics and experience in regional economic development for UK local government agencies. He explains economic theory and policy through clear, accessible writing informed by both academic training and real-world work.
Read Steve’s full bio
Recent Articles
-
Bank Reserves, Asset Inflation, and the Risk of Future Price Inflation
Dec 19, 25 04:16 AM
Learn what bank reserves are, how they affect asset prices, and why future reserve creation could lead to inflation through commodities and currencies. -
Credit Creation Theory; How Money Is Actually Created
Dec 16, 25 03:07 PM
Explore how modern banks create money through credit creation, why the money multiplier fails, and the role of central banks and reserves. -
U.S. Industrial Policy & The Unfortunate Sacrifice that Must be Made
Dec 12, 25 03:03 AM
U.S. Industrial Policy now demands a costly tradeoff, forcing America to rebuild its industry while sacrificing bond values, pensions, and the cost of living. -
The Global Currency Reset and the End of Monetary Illusion
Dec 07, 25 03:48 AM
The global currency reset is coming. Learn why debt, inflation, and history’s warnings point to a looming transformation of the world’s financial system. -
Energy Economics and the Slow Unraveling of the Modern West
Dec 06, 25 05:18 AM
Energy economics is reshaping global power as the West faces decline. Explore how energy, geopolitics, and resource realities drive the unfolding crisis.