- Home
- Market Failure
- Marginal Cost of Abatement

Marginal Cost of Abatement Explained
With regard to carbon emissions and other pollutants, the marginal cost of abatement is a key determinant in policy formulation if society is to reach an optimal level of production. It is, of course, a difficult and thorny issue that is often politically charged, but the analysis in this article simply explains the economics involved.
The abatement cost, by which I mean the cost that firms and industries would have to pay in order to clean up a given amount of the pollution that occurs as a by-product of its operations, varies on a case by case basis. This means that the optimal policy response must account for different scenarios as best it can.
This is no easy task, and there are often many unknown parameters that make precision impossible.
In the analysis that follows I make no assertion about the validity of any claims that certain types of pollution are harmful, harmless, over-hyped, under-reported and so on. These are all calculations for other people to make, I merely present the framework for making policy decisions.
The analysis is best presented with the use of graphs.
Marginal Abatement Cost Curve

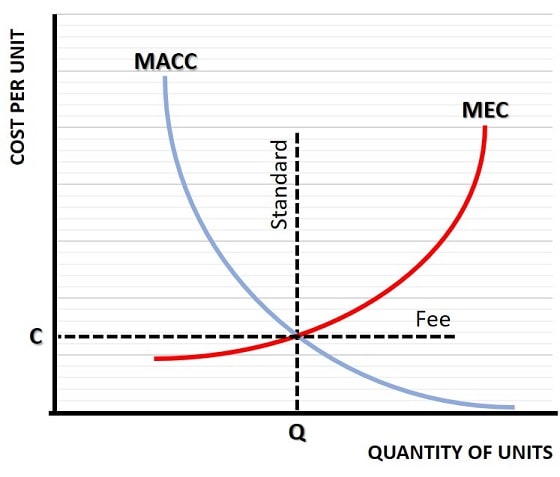
In the marginal abatement cost graph above, the MEC curve represents the marginal external cost that falls on third parties as a result of production/consumption of goods in a representative industry. I've explained this curve on a separate page, which you can read here:
As a quick reminder, these costs do not accrue to the manufacturer, they are external to its cost function and so they are ignored. This results in inefficiency, and it falls to the government to implement a corrective measure to address it.
The Marginal Abatement Cost Curve (MACC) represents the cost of cleaning up each unit of pollution that the industry creates. It is a downward sloping curve because each additional unit of pollution can be cleaned up more cheaply than the one before. At some point, it is possible for an industry to adopt zero emission technology such that any additional pollution beyond some minimal operational level can be cleaned up at no extra cost, and so the MACC slopes down towards a zero marginal cost point.
At the intersection of MACC and the MEC curve, we have an equilibrium point where the cost of a unit of pollution, i.e. the damage that it causes for third parties, is equal to the cost of cleaning it up. This occurs at a cost per unit of C, and a quantity of units of Q.
The two main policy options that governments have tended to choose, in order to get an industry to produce at this equilibrium level, are Emission Standards and Emission Fees. A standard simply imposes a fixed maximum quantity of pollution (Q), and then enforces it in law. A fee set at C per unit of pollution will internalize the cost of pollution for the industry and make it profit maximizing to voluntarily choose to produce at a quantity of Q. There are, of course, pros and cons for each of these options.
Emissions Standard versus Fee
The main complicating factor is that any individual firm within an industry will tend to have a unique marginal cost of abatement, and that means that a blanket industry wide emissions policy will hit each firm differently.
Depending on the nature of the problem, the government may wish to directly specify the level of pollution that it deems tolerable, in which case an emissions standard will be the better option since it enforces a strict upper limit on the amount of pollution that will result.
The downside to the emissions standard is that it will cause extra abatement costs for the industry as a whole compared to the abatement costs that an efficient emissions fee would have incurred. I say 'efficient' fee, because it is quite likely that the fee will be set at a suboptimal rate since it is extremely difficult to know with precision where an industry's MACC and MEC curve intersects, and a best guess is likely to be significantly off. That is the downside of a fee, it will likely be set at a suboptimal rate meaning that firms within the industry will create a sub-optimal amount of pollution. Again, a graph is useful for illustrating this.

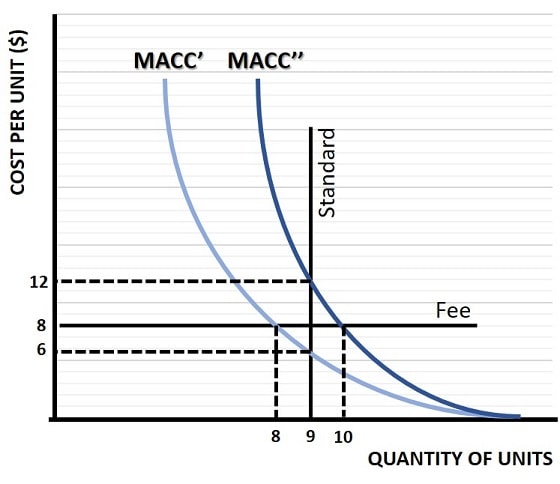
For simplicity we assume that two firms make up the entire industry, and that they each have a unique marginal cost of abatement as represented by the MACC' and MACC'' curves in the graph above.
If the government issues an emissions standard that restricts each firm to a maximum quantity of 9 units of pollution, the vertical line illustrates this restriction. It intersects the first firm's marginal abatement cost curve at a cost of $6 per unit. The second firm's MACC intersects the vertical emission standard line at a cost of £12 per unit.
Whilst this guarantees that emissions will not be more than 19 units for the industry as a whole, it is inefficient because firm 2 is paying $12 on the last unit of pollution when firm 1 could have reduced it instead for only $6. If it were possible for firm 1 to sell part of its 9 unit allocation to firm 2, perhaps for $9, then a mutually beneficial trade could occur that results in an overall efficiency gain for the industry without causing any extra pollution. This would be a policy of 'Tradable Pollution Permits', a much underutilized policy option.
Alternatively, an emissions fee can also achieve efficiency if the government sets it at a rate of $8 per unit of pollution. At this rate, firm 1 will clean up all units of pollution beyond 8 units, and firm 2 will clean up its pollution after 10 units. Again total pollution for the industry is 18 units, but for this to occur the government must accurately estimate that an $8 fee is the correct rate, and as mentioned already this is extremely difficult to do in the real world.
Total Abatement Cost Formula
Estimation of a total abatement cost formula is not possible from the curves shown in the diagrams above. This is because the curves represent marginal abatement costs rather than average costs.
However, we can assume that the total abatement cost for each firm must be low enough that it can still continue its production at a profitable level, otherwise it may go out of business. It may, of course, be feasible to invest in cleaner production techniques so that future production is profitable, but that is also a calculation that is beyond the framework of the model presented here.
Sources:
Related Pages:
- Marginal External Cost (MEC)
- Marginal Social Cost (MSC)
- Pigouvian Corrective Tax
- Socially Optimal Quantity
- Tradable Pollution Permits
- Externalities in Economics
- Types of Market Failure
About the Author
Steve Bain is an economics writer and analyst with a BSc in Economics and experience in regional economic development for UK local government agencies. He explains economic theory and policy through clear, accessible writing informed by both academic training and real-world work.
Read Steve’s full bio
Recent Articles
-
Bank Reserves, Asset Inflation, and the Risk of Future Price Inflation
Dec 19, 25 04:16 AM
Learn what bank reserves are, how they affect asset prices, and why future reserve creation could lead to inflation through commodities and currencies. -
Credit Creation Theory; How Money Is Actually Created
Dec 16, 25 03:07 PM
Explore how modern banks create money through credit creation, why the money multiplier fails, and the role of central banks and reserves. -
U.S. Industrial Policy & The Unfortunate Sacrifice that Must be Made
Dec 12, 25 03:03 AM
U.S. Industrial Policy now demands a costly tradeoff, forcing America to rebuild its industry while sacrificing bond values, pensions, and the cost of living. -
The Global Currency Reset and the End of Monetary Illusion
Dec 07, 25 03:48 AM
The global currency reset is coming. Learn why debt, inflation, and history’s warnings point to a looming transformation of the world’s financial system. -
Energy Economics and the Slow Unraveling of the Modern West
Dec 06, 25 05:18 AM
Energy economics is reshaping global power as the West faces decline. Explore how energy, geopolitics, and resource realities drive the unfolding crisis.